How to give meaning to the variations of the GDP, making non-economists able to use it?

So, what does it actually means that your country has increased the GDP by 2% or decreased by 4%? Maybe this is pretty clear for economists, but the rest of us would miss some information to use for decision-making. This is the problem that I wanted to solve here.
First, I should say that we had a great team working on it, and my job was to coordinate that throughout my product vision. I wanted to present the political and economical scenery of Brazil, based on the variation of the GDP for the last 30 years.
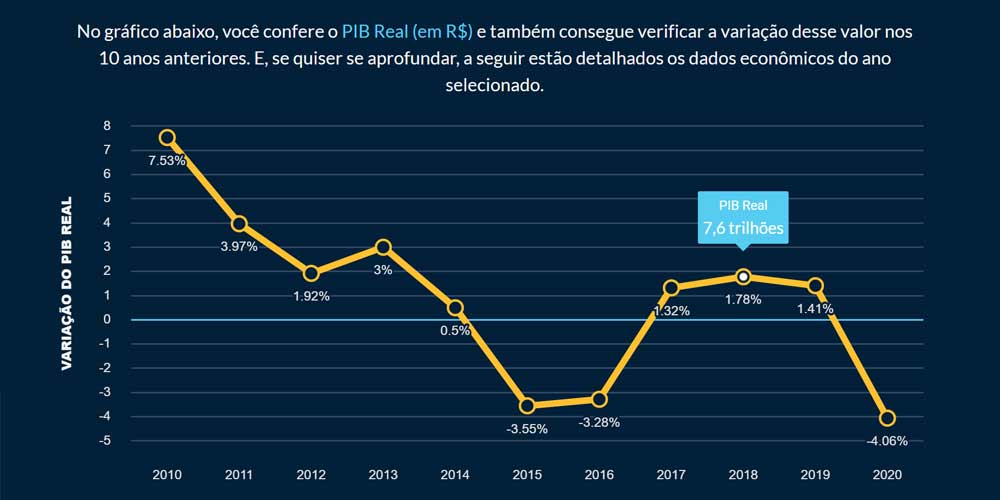
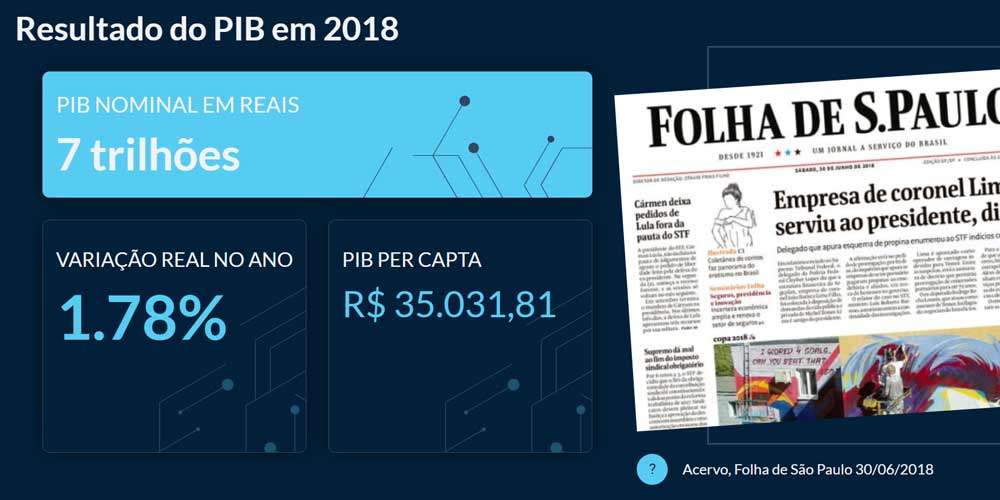
The idea was to bring together all the most relevant indicators. And they would be perceived according to the GDP of the same year. In this case, users can get to know about inflation, foreign trade, the population, the president in charge, and even the cover of a major Brazilian newspaper from the moment.
We also presented information on the science behind the GDP calculation, making clear the elements that constitute this indicator.